React-Based Dashboard & Management System
How we architected and built a comprehensive React-based dashboard and management system for enterprise clients, featuring real-time data visualization, role-based access control, and modular component architecture serving 5,000+ daily active users.

Project Overview
Our enterprise client needed a comprehensive dashboard system to manage their operations, users, and analytics across multiple departments. The existing system was built with legacy jQuery and was slow, unmaintainable, and lacked modern features. We designed and built a complete React-based solution using TypeScript for type safety, Redux Toolkit for state management, React Query for server state, and Tailwind CSS for styling. The dashboard features real-time data updates, interactive charts and tables, role-based access control, dark/light mode theming, and responsive design for mobile devices. The modular component architecture enables rapid feature development and easy maintenance.
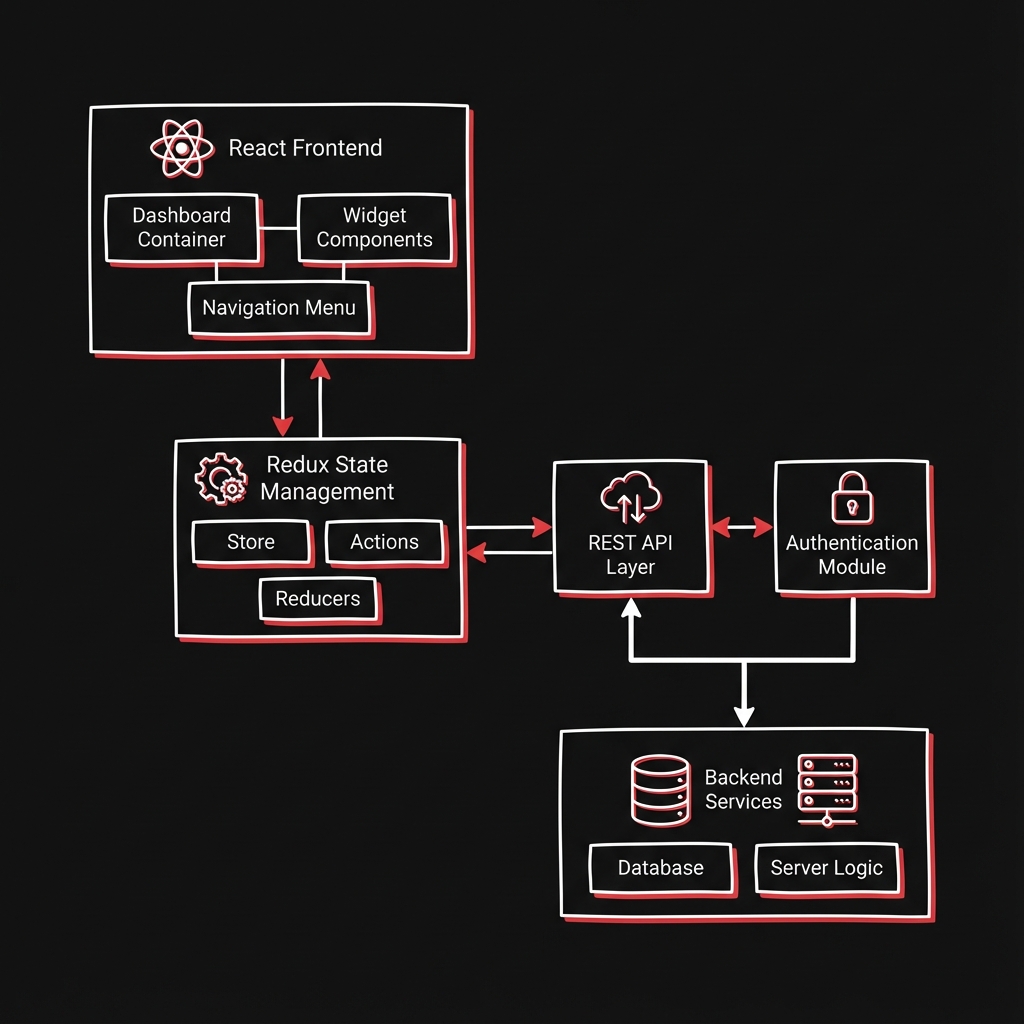
System Architecture
The dashboard follows a modular component architecture with clear separation of concerns. The presentation layer consists of reusable UI components built with React and styled with Tailwind CSS. The state management layer uses Redux Toolkit for global state and React Query for server state with automatic caching and refetching. The API layer provides a unified interface for all backend communications with request/response interceptors for authentication and error handling. Role-based access control is implemented at both component and route levels. The build system uses Vite for fast development and optimized production builds.
React + TypeScript
Type-safe component development with comprehensive IDE support and compile-time error detection
Redux Toolkit
Centralized state management with DevTools integration, async thunks, and slice-based organization
React Query
Server state management with automatic caching, background refetching, and optimistic updates
Tailwind CSS
Utility-first styling with custom design system, dark mode support, and responsive breakpoints
React Router v6
Declarative routing with protected routes, nested layouts, and lazy loading for code splitting
Recharts + AG Grid
Interactive data visualization with charts, graphs, and high-performance data tables
Implementation Details
Code Example
// Dashboard Component with Role-Based Access
import { useAuth } from '@/hooks/useAuth';
import { useQuery } from '@tanstack/react-query';
import { DashboardLayout } from '@/components/layouts';
import { MetricsCard, ActivityChart, UserTable } from '@/components/dashboard';

export function AdminDashboard() {
  const { user, hasPermission } = useAuth();

  const { data: metrics, isLoading } = useQuery({
    queryKey: ['dashboard-metrics'],
    queryFn: () => dashboardApi.getMetrics(),
    staleTime: 30000, // Cache for 30 seconds
  });

  return (
    <DashboardLayout>
      <div className="grid grid-cols-1 md:grid-cols-3 gap-6">
        {metrics?.map((metric) => (
          <MetricsCard key={metric.id} {...metric} />
        ))}
      </div>

      {hasPermission('analytics:view') && (
        <ActivityChart data={metrics?.activity} />
      )}

      {hasPermission('users:manage') && (
        <UserTable />
      )}
    </DashboardLayout>
  );
}
Agent Memory
Using React.lazy() with route-based code splitting reduced initial bundle size by 40%. Each dashboard section loads only when accessed, improving initial load time from 4s to 1.5s.
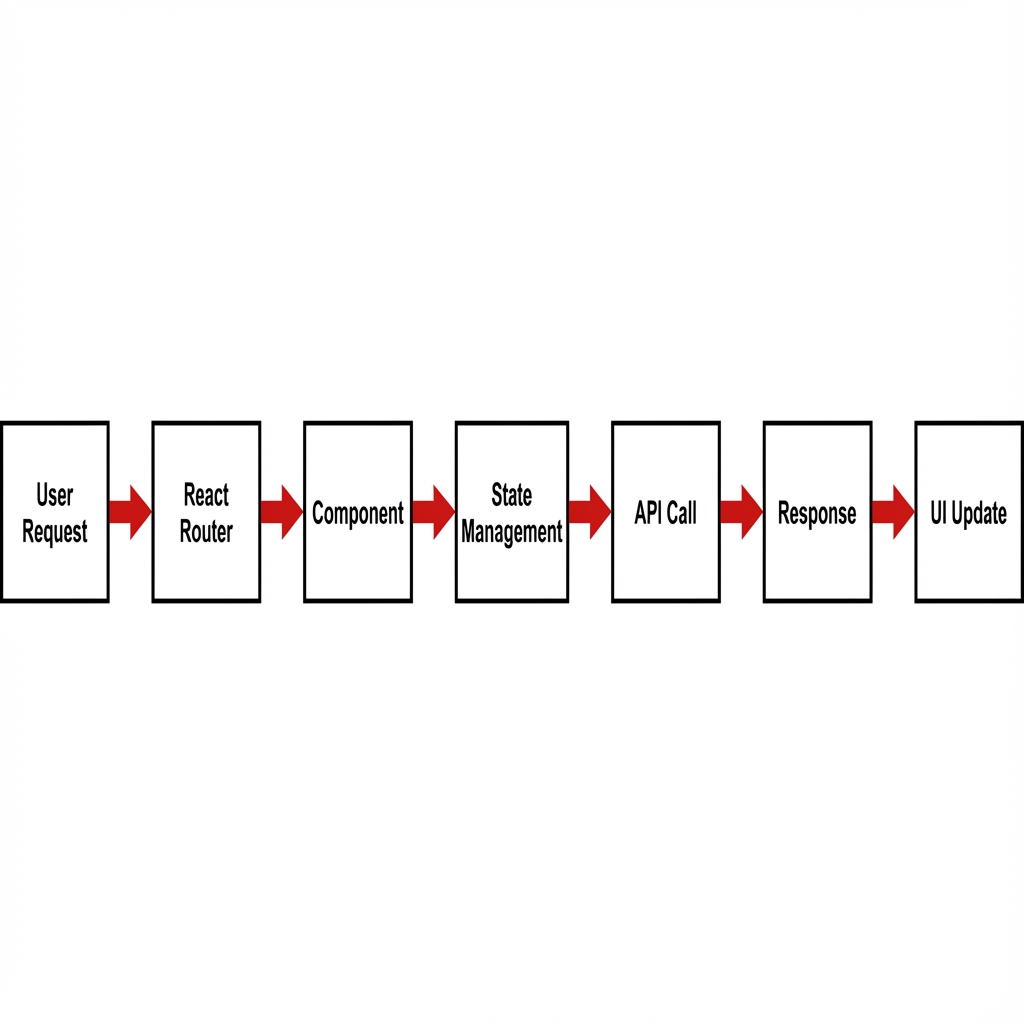
Workflow
Component Design: Create reusable UI components following atomic design principles.
State Architecture: Set up Redux slices for global state and React Query for API data.
API Integration: Build API layer with typed endpoints and response handling.
Routing Setup: Configure protected routes with role-based access control.
Feature Development: Build dashboard sections as isolated modules.
Testing: Write unit tests for components and integration tests for features.
Performance Optimization: Implement code splitting, memoization, and virtual scrolling.
Deployment: Set up CI/CD pipeline with automated testing and preview deployments.
Results & Impact
"The new React dashboard transformed how our team works. The speed improvements and intuitive interface have made everyone more productive. Our users love the real-time updates and responsive design."
Performance
60% faster page loads through code splitting and optimized rendering
User Engagement
45% increase in daily active users due to improved UX
Development Speed
50% faster feature development with reusable component library
Maintainability
80% reduction in bug reports through TypeScript and testing
About the Author
Sunnykumar Lalwani
Principal Engineer - Backend and Systems Architecture
Apex Neural
12+ years designing high-performance backend and distributed systems. Expertise in scalable system design, DevOps automation, and cloud-native infrastructure. Strong focus on AI-powered applications, LLM integrations, and data-driven workflows. Combines hands-on full-stack work with architectural governance.
Ready to Build Your AI Solution?
Get a free consultation and see how we can help transform your business.